Profitability Index vs Net Present Value: Key Differences

As a company grows, it faces crucial decisions on how to best invest its resources. Capital budgeting is important in this process, helping businesses make complex investment choices and find the best opportunities to make money.
Investing capital involves navigating various challenges unique to each project, such as securing funding, managing costs, understanding tax implications, and allocating resources efficiently. These factors are critical in shaping a company’s financial strategy.
But in real-world finance, things aren’t always simple.
Effective capital budgeting typically involves employing various analytical methods to inform decisions. Two key methods are Net Present Value (NPV) and Profitability Index (PI), which help businesses assess the potential success and profitability of their investments.
These methods guide companies to invest wisely and make sure their decisions support their long-term financial goals.
What is the Profitability Index Method (PI)?
A profitability index is a financial tool that can tell us whether an investment should be accepted or declined. Also, with the Profitability Index formula (or profitability index calculator) we are able to estimate the ratio between the present value of future cash flows and the initial investment.

Understanding the Profitability Index
The Profitability Index (PI), also known as the benefit-cost ratio, helps determine the value a project can generate. A PI greater than 1.0 suggests that the project’s discounted cash inflows exceed its outflows, indicating profitability. Conversely, a PI less than 1.0 shows that the costs outweigh the benefits, and such projects are typically rejected. A PI of exactly 1.0 implies a break-even situation where the project neither gains nor loses money.
In scenarios where capital is limited and choices must be made among competing projects, the project with the highest PI is preferred because it promises the most efficient use of capital.
While some projects might have higher net present values, they might be overlooked if their PI is lower, as they do not offer the most advantageous use of resources.
Note: When discussing PI and NPV, it’s essential to consider the role of Net Operating Income (NOI). A deeper understanding of NOI is vital for assessing investment performance. Learn more about the importance of Net Operating Income (NOI) in real estate.
What is PI Used For?
The Profitability Index (PI) is a tool for comparing different investment opportunities. It is particularly valuable for companies facing limited resources, helping them decide which projects to prioritize. The PI is often used together with other financial metrics to identify the most beneficial investments, ensuring resources are allocated to projects that offer the highest returns.
Profitability Index Formula
When we obtain the information from the net present value calculator, we can determine a profitability index for the investment. The profitability index is calculated with the following formula:

To calculate the profitability index, we need only to know the present value of the future cash flows. To get this number (the present value of all the future cash flow), we add up the present values (of the cash flows) that occur from Year 1 to Year 10.
Note: Another critical aspect is the capitalization rate, which helps determine the potential returns of an investment. Understanding how to calculate capitalization rates can provide further insights into the investment’s viability.
In What Situation Is the Profitability Index a Better Option?
The Profitability Index (PI) can serve as an alternative to the Net Present Value (NPV) method, particularly useful once we calculate the profits per dollar of investment. It is especially valuable in scenarios involving capital rationing.
For instance, consider two mutually exclusive projects that yield the same NPV, but one requires twice the investment of the other. In such cases, the PI provides a clearer comparison by reflecting the relative efficiency of each investment.
Additionally, when deciding between two mutually independent projects with identical NPVs, investors typically prefer the project with the lower initial cost or higher PI, as it indicates a more efficient use of capital.
Benefits of Using the Profitability Index Method
- Relative Efficiency: PI measures the profitability per unit of investment, allowing for effective comparison of projects of different sizes.
- Useful in Capital Rationing: It helps prioritize projects that yield the highest returns relative to their costs, optimizing the allocation of limited resources.
- Flexibility in Decision Making: PI provides a clear metric that aids in quick and informed decision-making regarding investments.
- Compatibility with Other Metrics: It complements other financial evaluations like NPV or IRR, enhancing overall financial analysis.
- Focus on Value Creation: PI ensures that projects not only generate profit but also create significant shareholder value.
- Ideal for Smaller Projects: It’s particularly useful for assessing smaller projects that may be overlooked by broader metrics like NPV.
What is Net Present Value (NPV)?
Net Present Value (NPV) is a financial metric used in capital budgeting and investment planning to assess the profitability of a project or investment. It represents the difference between the present value of cash inflows and the present value of cash outflows over a period of time.
- Cash Flows: NPV calculations involve all the cash inflows and outflows associated with a project. These might include initial investment costs, returns or revenues generated by the investment, and any ongoing or final costs.
- Discount Rate: The cash flows are discounted using a rate that reflects the risk and opportunity cost of the investment. This rate could be the cost of capital or a required rate of return. The purpose of discounting is to convert future amounts of money into their equivalent value today, acknowledging that money available now is worth more than the same amount in the future due to its potential earning capacity.
- Present Value: The present value of each cash flow is calculated by applying the discount rate. The sum of all these present values of the inflows and outflows forms the net present value.
- Decision Rule: A positive NPV indicates that the projected earnings (in present value terms) exceed the anticipated costs, thus making the project potentially profitable and worth considering. Conversely, a negative NPV suggests that the project’s costs outweigh the benefits, and it should perhaps be rejected.
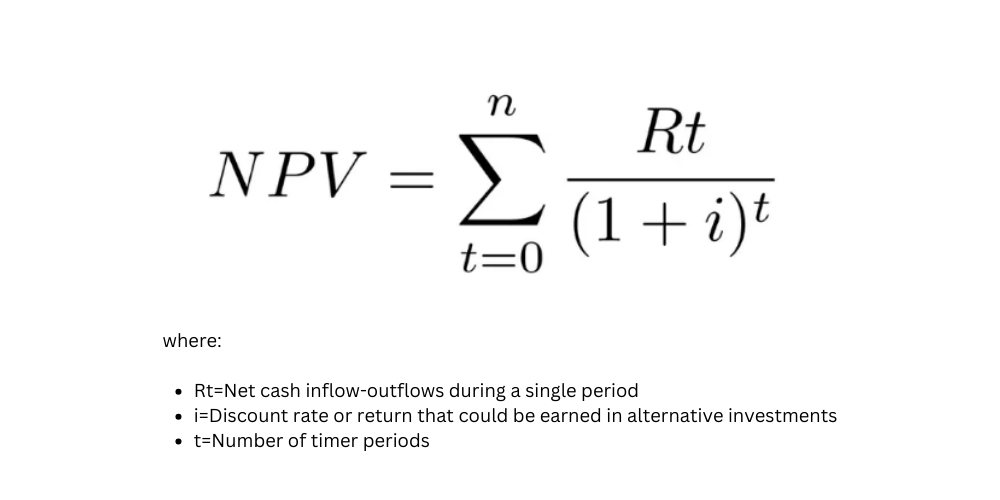
- NPV Formula: Mathematically, NPV is calculated as:
NPV is widely regarded as one of the most reliable and realistic techniques for evaluating the economic viability of long-term projects, as it incorporates the time value of money and provides a direct measure of the expected increase in value to the firm.
What Does a Negative NPV Mean?
A negative Net Present Value (NPV) indicates that the projected cash flows from an investment or project, when discounted back to their present value, do not cover the initial investment cost.
In simpler terms, the total amount of money expected to be gained from the project is less than the amount spent on it. This outcome suggests that the project is expected to result in a net loss for the investor based on the assumptions used in the calculation.
When Is NPV Considered a Superior Technique?
The net present value method is a comprehensive tool taking into consideration all aspects of the investment, such as:
- All cash inflows and outflows,
- The time period over which they occur, and
- The risks associated with the investment.
As such, the NPV provides a transparent way to measure how much value a project adds for shareholders. It facilitates easy comparison between different projects due to its clear, numerical output.
NPV accounts for the time value of money, ensuring that all cash flows are considered up to the end of the project’s life. This is particularly useful when comparing projects with the same profitability index but different levels of investment.
Ready to Start Your Investment Journey? Contact IPG Today!
If you’re seeking expert guidance on capital investment decisions, look no further. Our team at IPG is here to assist you with personalized advice and strategic solutions. Whether it’s understanding NPV, selecting the right discount rate, or any other investment queries, we’ve got you covered. Reach out to IPG now and take the first step towards making informed, profitable investment choices.
Explore More Insights