Vacancy Rate Explained: Why It Matters in CRE

Understanding the vacancy rate is essential for anyone navigating the world of commercial real estate. Whether you’re an investor, broker, tenant, or landlord, this simple metric holds major insights about market conditions, property performance, and investment potential.
What Is a Vacancy Rate?
Vacancy rate refers to the percentage of all available units or space in a commercial property that is currently unoccupied and not generating rental income. In CRE, vacancy rate is a key performance indicator used to assess the health of a building, submarket, or city.
Why Vacancy Rate Matters
Vacancy rate isn’t just a number — it’s a reflection of market supply and demand. High vacancy rates might indicate an oversaturated market or declining demand, while low vacancy rates signal a competitive environment with limited available space.
For investors and developers, vacancy rates can impact:
- Pricing strategies
- Lease negotiations
- Investment decisions
- Forecasting returns
For tenants, vacancy rates can influence:
- Rent rates
- Lease terms
- Flexibility in location and space options
How to Calculate Vacancy Rate
The formula for vacancy rate is straightforward:
Vacancy Rate (%) = (Vacant Space / Total Available Space) × 100
Example:
If a 100,000 square foot office building has 10,000 square feet of unoccupied space, the vacancy rate is:
(10,000 ÷ 100,000) × 100 = 10%
San Francisco Office Vacancy Rate: A Real-World Case
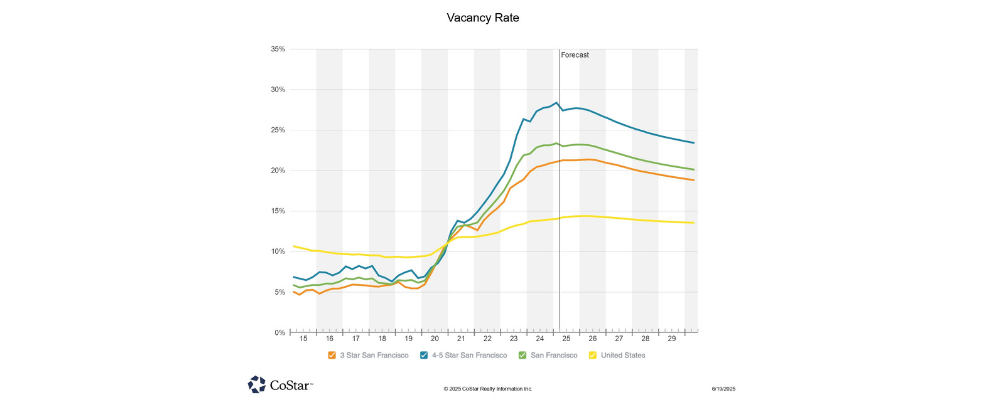
As of Q2 2025, San Francisco’s office vacancy rate stands at 22.9%, marking a 60 basis point increase from the previous year. While this may appear discouraging at first glance, it’s important to note that the pace of vacancy growth has slowed, a sign that the market may be stabilizing.
For context, San Francisco’s vacancy rate was just 5.9% in 2019, making it one of the healthiest office markets in the country at the time. Today, the available office space totals 49.7 million square feet, with 9.3 million square feet available for sublease.
Higher-end assets continue to feel the pressure: Class 4 & 5 Star buildings report a vacancy rate of 27.4%, playing a significant role in the overall market softness. That said, a slight decline in the availability of space, including subleases, suggests that the worst may be behind us.
San Francisco’s case illustrates how vacancy rate trends can offer a nuanced snapshot of market health—highlighting not just current conditions, but also potential turning points. (source: CoStar)
We broke down some of this recent activity in our blog:
AI Demand Signals a Potential Turning Point for SF’s Office Market
Other encouraging signs include absorption gains in the Financial District:
Financial District Sees Strongest Office Leasing Since 2019
Interpreting Vacancy Rates in Context
It’s important to understand that different property types and locations will have different “healthy” vacancy ranges. For instance:
- A 5%–10% vacancy rate in an office submarket may be considered balanced.
- In industrial real estate, vacancy below 5% often signals strong demand and limited supply.
- Multifamily properties tend to stabilize around 4%–6% in strong markets.
Want to see how vacancy affects multifamily performance? Multifamily Market Kicks Off 2025 with Record Absorption
Final Thoughts
Vacancy rate is a simple but powerful tool in CRE analysis. It influences rents, property values, and market sentiment — and should always be viewed in the context of broader economic and local trends.
If you’re evaluating a property or planning your next investment, vacancy rate is one of the first numbers you should check.
Explore More Insights